pyKVFinder.plot_frequencies
- pyKVFinder.plot_frequencies(frequencies: Dict[str, Dict[str, Dict[str, int]]], fn: str | Path = 'barplots.pdf') None[source]
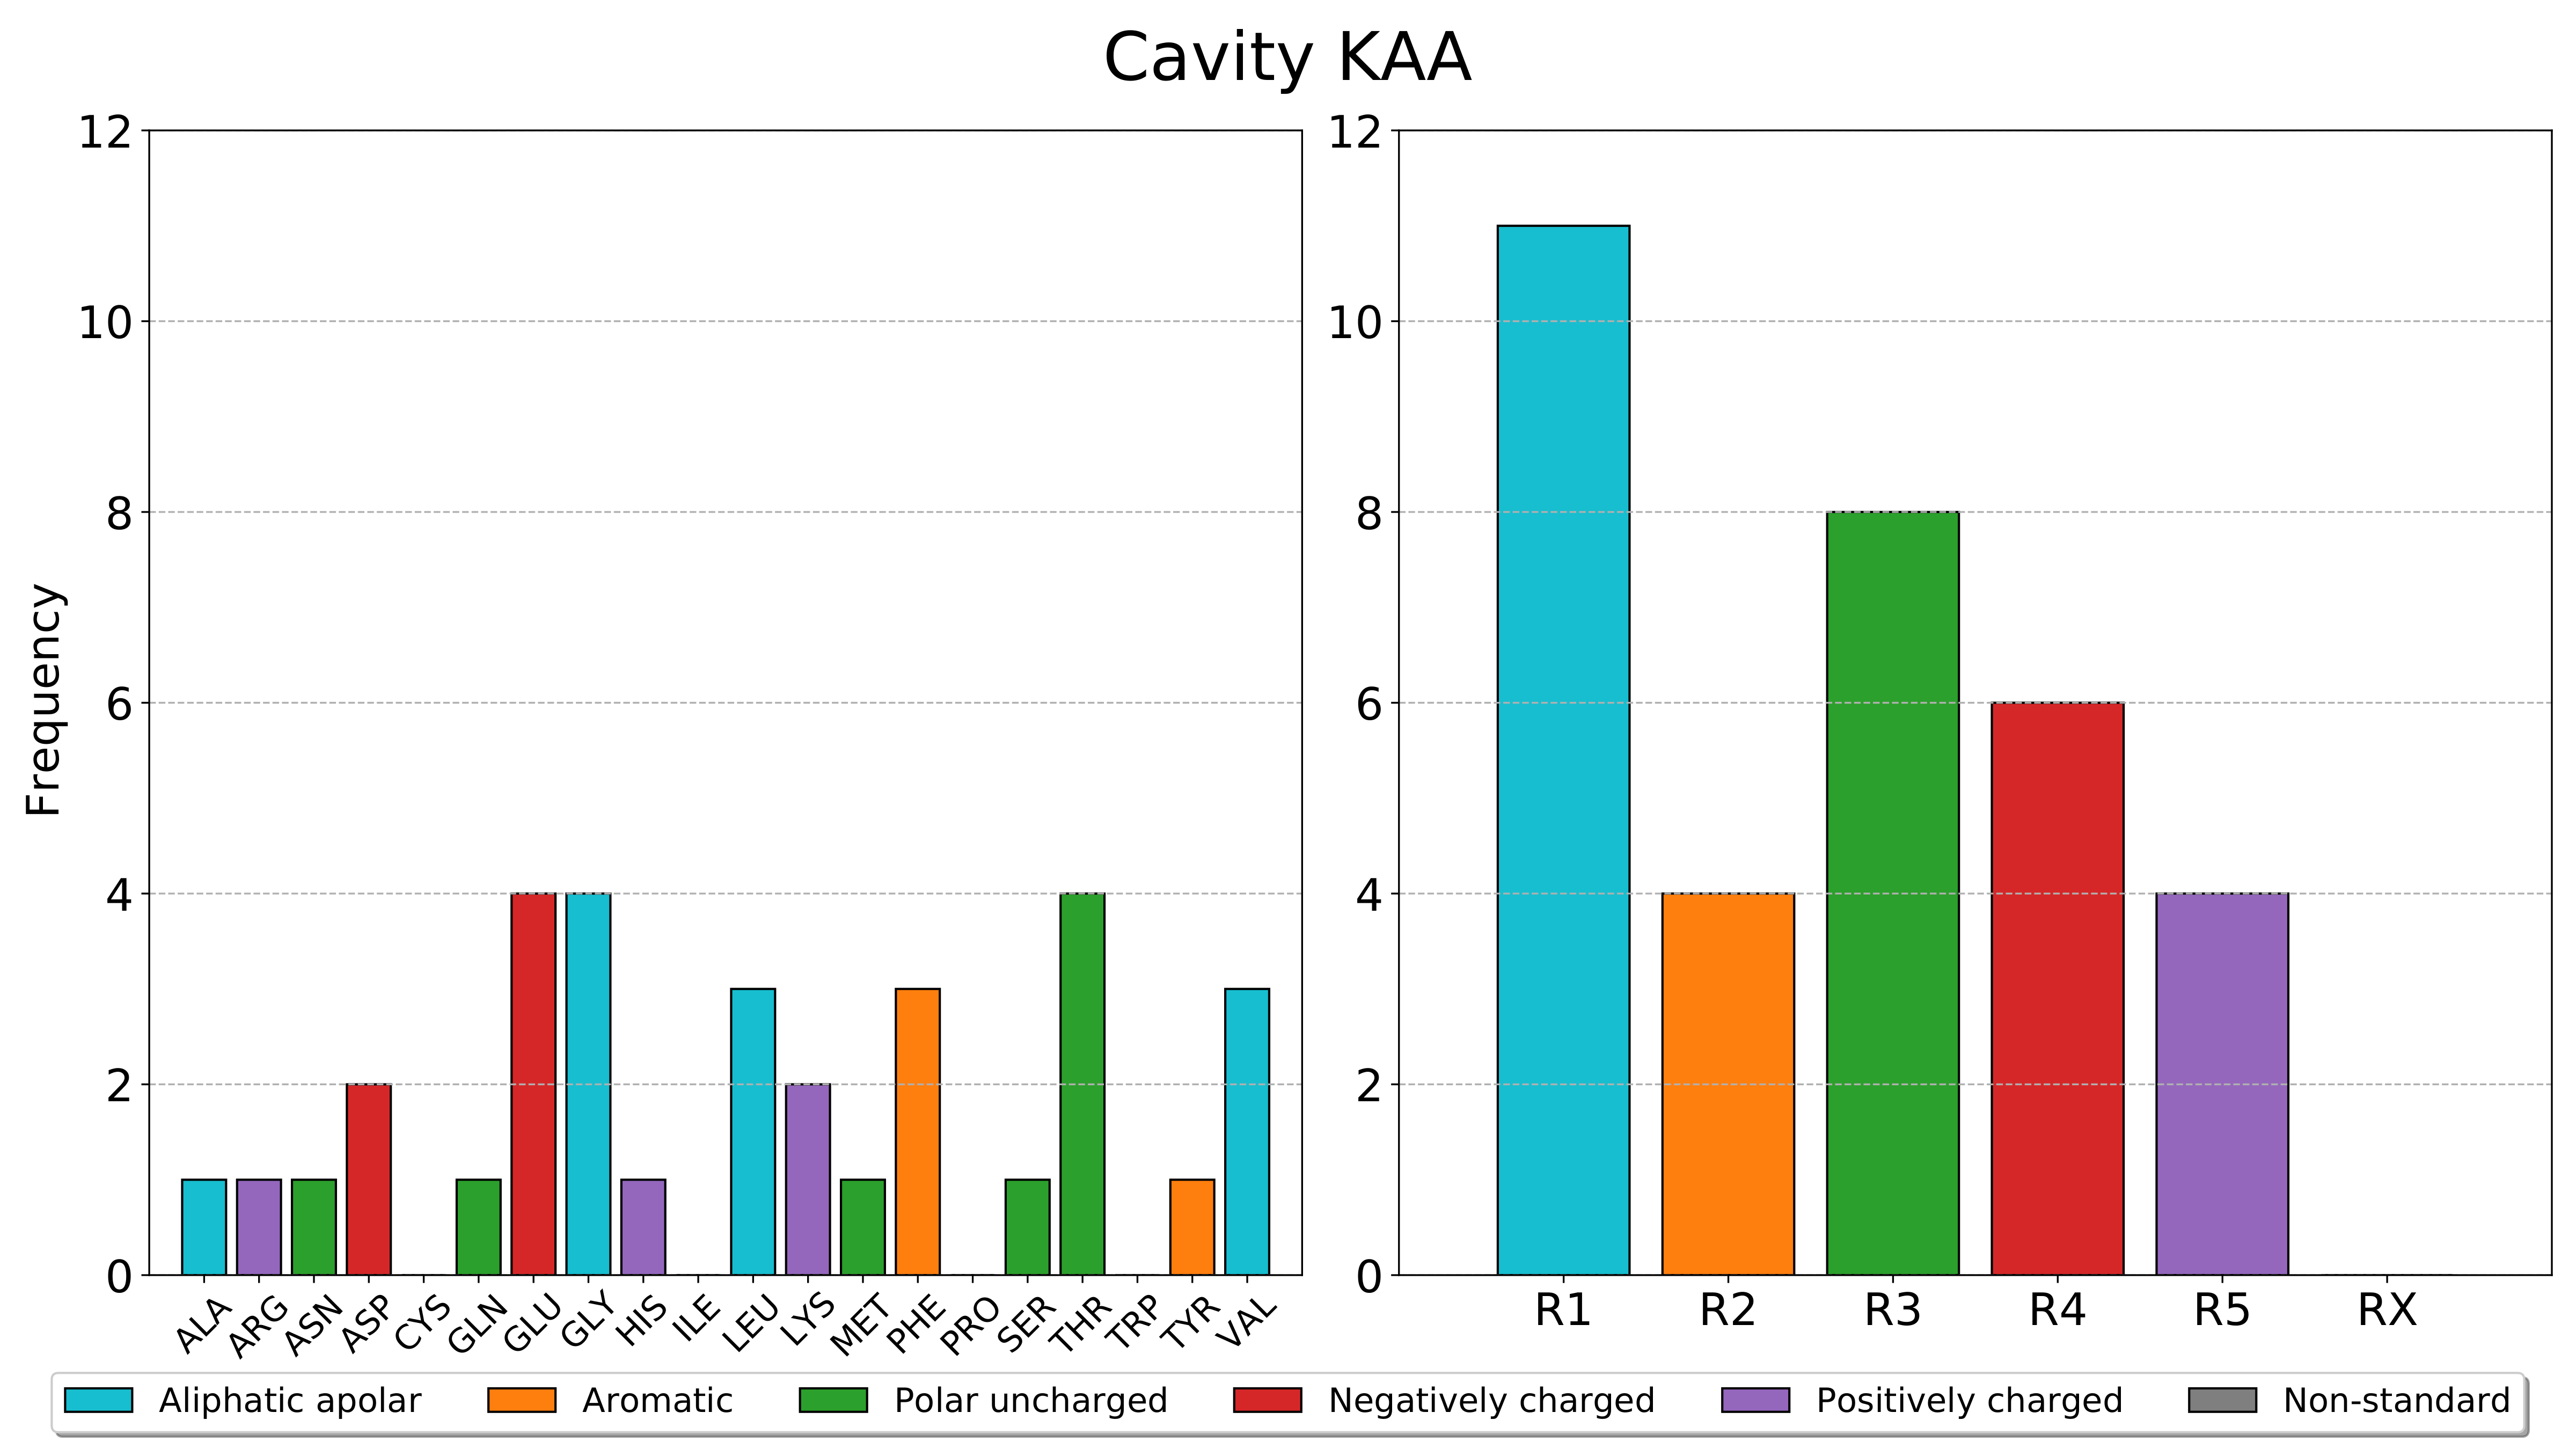
Plot bar charts of calculated frequencies (residues and classes of residues) for each detected cavity in a target PDF file.
- Parameters:
- Raises:
TypeError – fn must be a string or a pathlib.Path.
Note
The cavity nomenclature is based on the integer label. The cavity marked with 2, the first integer corresponding to a cavity, is KAA, the cavity marked with 3 is KAB, the cavity marked with 4 is KAC and so on.
Note
The classes of residues are:
Aliphatic apolar (R1): Alanine, Glycine, Isoleucine, Leucine, Methionine, Valine.
Aromatic (R2): Phenylalanine, Tryptophan, Tyrosine.
Polar Uncharged (R3): Asparagine, Cysteine, Glutamine, Proline, Serine, Threonine.
Negatively charged (R4): Aspartate, Glutamate.
Positively charged (R5): Arginine, Histidine, Lysine.
Non-standard (RX): Non-standard residues.
See also
Example
With the residues and classes of residues frequencies calculated with
calculate_frequencies, we can plot the bar charts of these frequencies in a PDF file.>>> from pyKVFinder import plot_frequencies >>> frequencies {'KAA': {'RESIDUES': {'ALA': 1, 'ARG': 1, 'ASN': 1, 'ASP': 2, 'GLN': 1, 'GLU': 4, 'GLY': 4, 'HIS': 1, 'LEU': 3, 'LYS': 2, 'MET': 1, 'PHE': 3, 'SER': 1, 'THR': 4, 'TYR': 1, 'VAL': 3}, 'CLASS': {'R1': 11, 'R2': 4, 'R3': 8, 'R4': 6, 'R5': 4, 'RX': 0}}} >>> plot_frequencies(frequencies, fn='barplots.pdf')